One of the big challenges with working with Documentum is debugging code that is deployed to the Content Server’s Java Method Server (JMS). Deploying code updates to the JMS can be tedious because it the JMS is typically on a remote server for developers, and it usually takes a long time to restart when code changes are deployed. The Java Method Server is also shared by all repositories on the content server, so continuously restarting the server for debugging can impact other repositories. Logging for the JMS can also be tricky to configure, and log files can be difficult to locate.
This article will describe how to set up remote debugging in Eclipse for code that runs on the Documentum Java Method Server.
The ability to remotely debug code using an integrated development environment (IDE), such as Eclipse, is an extremely useful tool to developers because it allow them to step through the code as it’s executing. Because the Documentum Java Method Server is actually just a Java servlet container behind the scenes, remote debugging with an IDE can be configured just like any other servlet container.
Starting with Content Server version 6.5, the Documentum Java Method Server uses a JBoss servlet container. This article with give the steps for remotely debugging JMS code using the Eclipse IDE with a JBoss JMS, however, similar steps could be used to configure remote debugging in other IDEs and/or a Documentum 5.x (Tomcat) or Documentum 6.0 (WebLogic) JMS.
Enable Remote Debugging on the Java Method Server
NOTE: Remote debugging should only be enabled in development environments.
To enable remote debugging on the JBoss JMS, you have to modify the JBoss start script.
Windows
Typically the JMS runs on the Documentum Content Server, and the start script can be found at %DOCUMENTUM%jboss4.x.xserverstartMethodServer.cmd in a Windows environment. Modify the startMethodServer.cmd script, adding the following at the beginning of the script.
set JAVA_OPTS=-Xdebug -Xrunjdwp:transport=dt_socket,address=8000,server=y,suspend=n %JAVA_OPTS%
Unix/Linux
Typically the JMS runs on the Documentum Content Server and the start script can be found at $DOCUMENTUM/share/jboss4.x.x/server/startMethodServer.sh in a Unix or Linux environment. Modify the startMethodServer.sh script, adding the following line at the beginning of the script.
JAVA_OPTS="-Xdebug -Xrunjdwp:transport=dt_socket,address=8000,server=y,suspend=n $JAVA_OPTS"
After modifying the start script, restart the JMS.
Configure Remote Debugging in Eclipse
Assuming that the code that is running on the Java Method Server already exists in an Eclipse project, follow these steps to begin debugging JMS code in Eclipse.
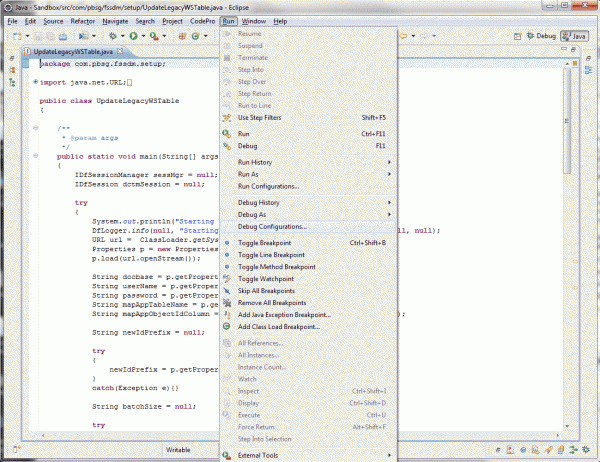
- In Eclipse, click Run > Debug Configurations.

- In the left panel, select Remote Java Application.
- Click the icon in the upper left corner to create a new launch configuration.

- Provide a Name for the debugging configuration.
- Select the eclipse Project that contains the JMS code that you wish to debug.
- Select Standard (Socket Attach) as the Connection Type.
- Specify the Host and Port in the Connection Properties section. The host will be the server name or IP address of the server where your JMS is running (typically the Documentum Content Server). The port is the address that you specified when you edited the JMS start script in the previous step (default 8000).
- Click the Apply button to save the changes.

- Click the Debug button to begin debugging.
After debugging has started, you can add breakpoints to your JMS code in Eclipse, and the execution of the code will stop when the breakpoints are hit, allowing you to step through your code, view variables, etc. as your code is executing. Refer to the Eclipse help documentation for more information on using the debugging features of Eclipse.

Ammar Khalid says
Thanks a lot for always sharing knowledge. Really appreciate your input into all the good work in the ECM domain and documentum.